Do-It-Yourself Visual Dashboards
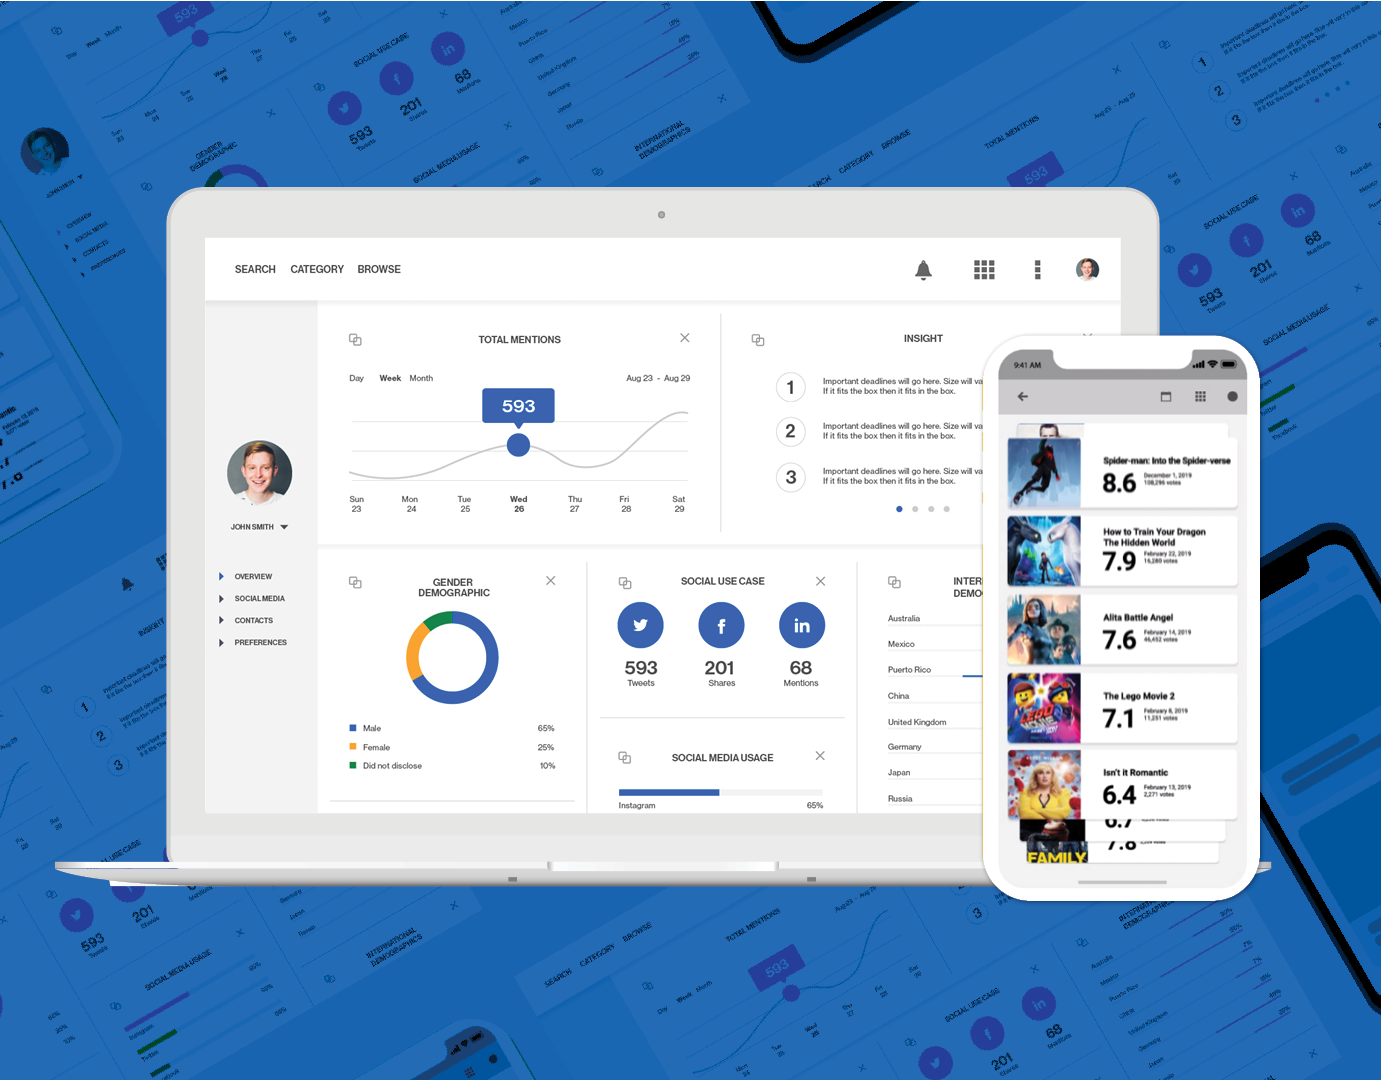
The InMoment Platform manages over 50,000 users, and the number one requested feature was a new dashboard creation tool to enable analysts and clients to quickly create their own visualizations. I was responsible for designing the user flow, Interface, and overall experience - version 1 became our largest payload of features shipped by the company to date.
In Canvas Preview with Live Customization and Drag & Drop Layout.
The key selling points of this tool were the live preview function where you could see your edits done live and in context of the final dashboard as well as an extensive settings panel which allowed full customization. We also shipped a robust drag and drop layout functionality enabled easy dashboard layout and styling.
Devil in the Details.
Given how massive this undertaking was I invested time to ensure proper documentation was created to communicate with developers and upper management the function and purpose of every component of the project. Not only did this accelerate development time but it also solved confusion about functionality and intention between design and engineering.
The Value of Research.
Given the time investment required to complete this project and as a best practice for any kind of Product Design I made sure to invest a good amount of effort understanding the problem and possible solutions.
Learnings moving forward.
Currently we are in the process of enhancing the dashboard creator by adding additional layout functionality such as row creation and auto snapping widget positions.
